Tools
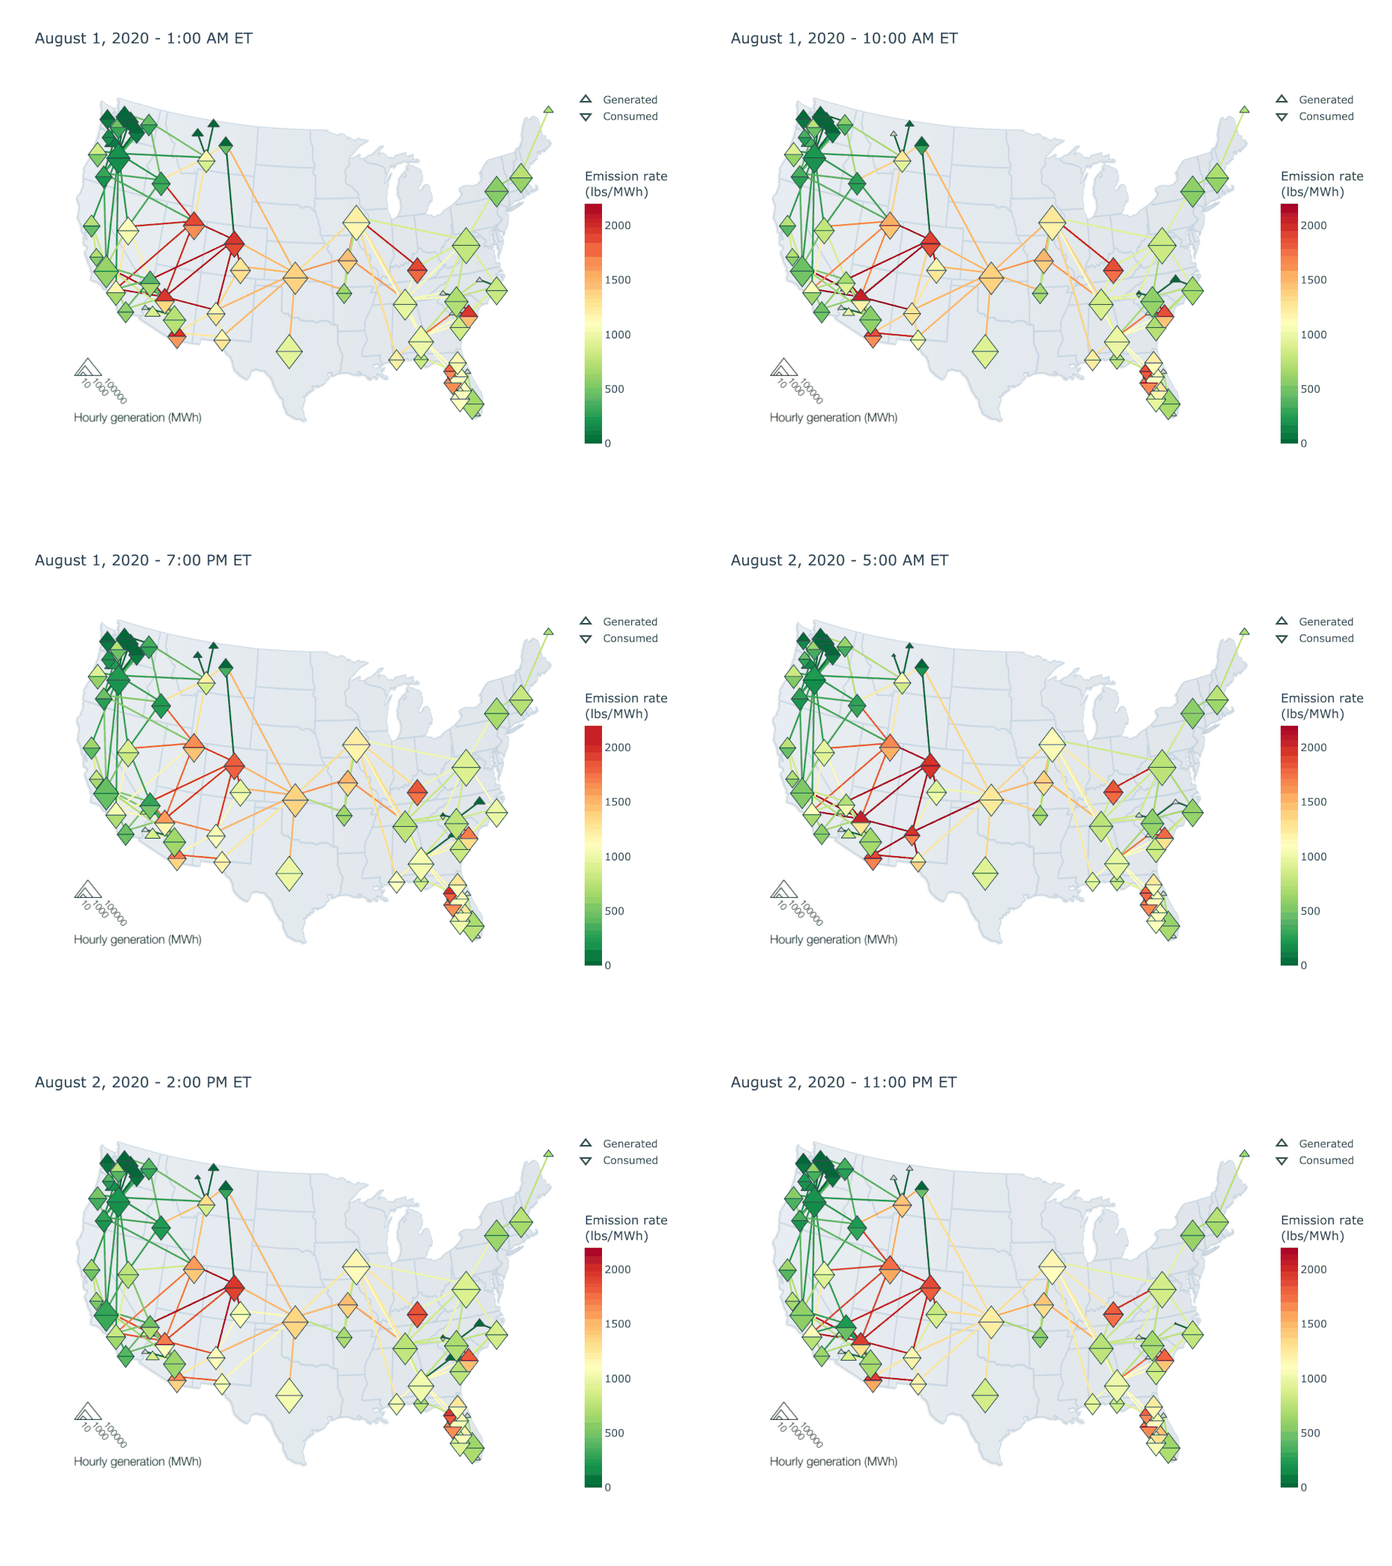
Grid emissions data. Open-source, peer-reviewed, built on measured readings.
eGRID hasn't been updated since 2023 data, and its future is uncertain. Open Grid Emissions covers the hourly Scope 2 accounting use case, built on measured CEMS data. The Grid Carbon API adds real-time access. GRETA goes deeper: generator-level Scope 1 emissions at 5-minute resolution, for utilities and grid operators who need to know where every ton came from.
Open source · Free to use
Open Grid Emissions
Open Grid Emissions covers all U.S. balancing authorities at the hourly resolution GHG Protocol Scope 2 increasingly requires. Over 90% of emissions data comes from measured CEMS readings, not estimates. It's built for emissions accounting, not as a full substitute for every eGRID output. Free to download under CC-BY-4.0.
Scope 2 reporting is moving toward hourly requirements. The buyer’s guide explains what that shift looks like in practice →
Real-time · Free trial available
Grid Carbon API
Real-time grid carbon intensity data for the U.S., consistent with WRI GHG Protocol carbon accounting methodology. Developers, enterprises, and energy practitioners use it for Scope 2 reporting and product decisions that require traceable emissions data.
Traceable methodology
Every figure traces back to a documented source: grid operator data, ISO/RTO records, WRI GHG Protocol. If your auditors or customers ask where the number comes from, you can show them.
Independent sourcing
Data pulled directly from ISOs, RTOs, and government agencies. Extensive QA flags anomalies before they reach your reports.
Consumed emissions, not generated
Scope 2 location-based accounting requires the emissions from electricity you actually consumed, not just what was generated nearby. This data accounts for cross-boundary power flows; eGRID does not.
Support
Hourly data quality report cards and alerts. Our team includes power systems and carbon accounting experts; reach us at info@singularity.energy with questions about your specific application.
For utilities & grid operators
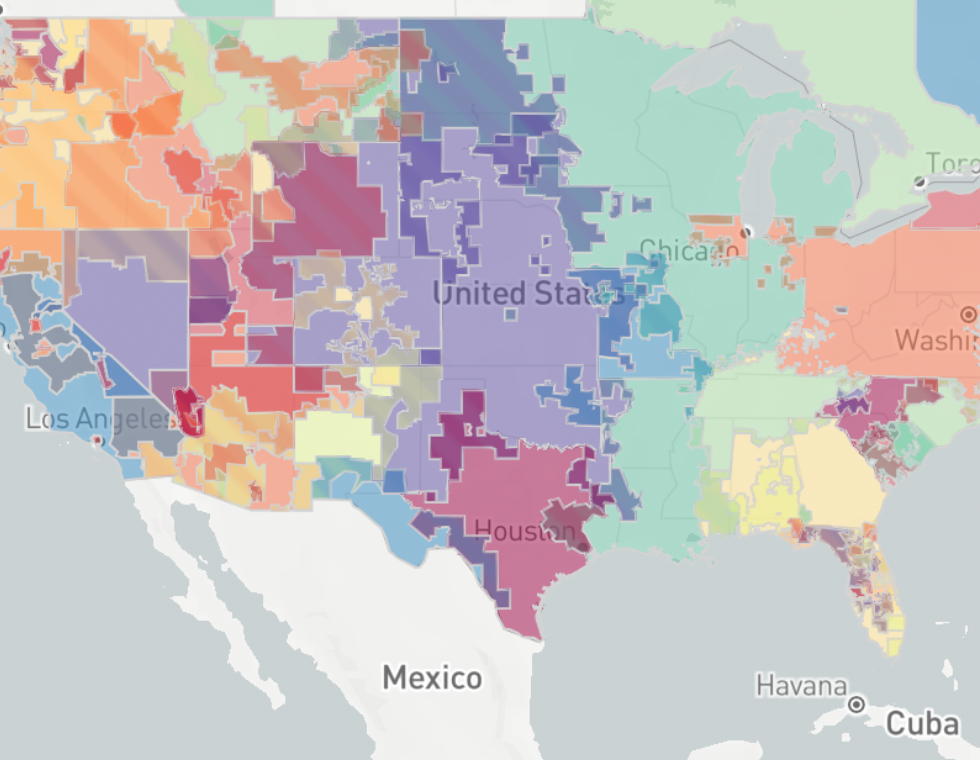
GRETA — Generator Real-Time Emissions Assignment
GRETA calculates direct stack emissions from electric generators using only their net generation output. Instead of static annual emission factors, it fits generator-specific heat rate curves from three years of EPA CEMS data, then accounts for operating state, seasonal variation, fuel switching, and combined heat and power allocation. The result is interval-level emissions — in lb of CO2, CH4, N2O, and CO2e — at 5-minute or hourly resolution.
Generator-specific heat rate curves
Each generator gets its own second-order polynomial curve, fitted to historical CEMS data. Separate models handle distinct operating states — startup, partial-on, cycling, shutdown — and ozone-season efficiency differences where data permits.
Interval-level Scope 1 output
Every interval returns fuel type, fuel consumption in mmBTU, and mass emissions (lb) of CO2, CH4, N2O, and CO2e, plus emission rates in lb/MWh. Works at 5-minute or hourly resolution depending on what your systems produce.
Fuel identification built in
A fuel-switching model runs before the heat rate calculation to identify what each generator is burning per interval — critical for multi-fuel plants. Combined heat and power units get a separate CHP electric allocation step to correctly attribute emissions.
Trained on measured CEMS data
Training draws from three years of EPA Continuous Emissions Monitoring System readings, EIA Forms 860 and 923, and Singularity's Open Grid Emissions dataset. MISO uses GRETA in its CarbonFlow application, passing 5-minute generation data from across its footprint.
Singularity Energy
Running a utility clean energy program?
These tools are built on the same carbon accounting work Singularity does inside utilities. If you need that methodology applied to your program data (customer attribution, hourly reporting, compliance documentation), that’s what the platform is built for.
Get a demo →Large C&I buyer? If you want this level of data from your utility (hourly by source, matched to your actual load), ask your utility about the platform. The Georgia Power deployment with Google is an example of what that looks like.